How can you tell when a Prius battery is beginning to fail?
How long will a Prius battery last?
How much will a Prius battery cost to replace?
These are questions that have concerned many of our customers who were either considering buying a hybrid, or had already purchased a hybrid. Let me start this article by saying, battery problems are very low on the list of problems we’ve found on the hybrids we repair. The level of concern about battery packs is massively disproportionate to the actual rate of failure.
08/20/2021 update:
This is a pretty old article. I still agree with most of what I said way back when, but it you’re just wondering how long a hybrid battery lasts, and aren’t interested in the technical details, click the link for a newer, less-technical article.
How Long will a Prius battery last?
So far, we’ve seen many Insight and Gen1 Civic batteries fail. To Honda’s credit, the bulk of them were covered under the standard or extended warranty. We’re now seeing Honda cars coming back for their second battery replacement out of warranty.
We’ve seen a lot of Gen1 Prius battery failures; I’d guess we’ve seen over 100 at this point. That may seem like a lot, but it’s a drop in the bucket when compared with other types of expensive repairs. We’re in Berkeley, so we have a lot of Gen1s still coming in and we’re still seeing at least one bad battery per month. At first most of the batteries were covered under warranty, but it has been 12 years since the last 2003 was sold, so none are covered anymore.
Did the recall have anything to do with battery failures?
The Gen1 batteries had a lot of problems with electrolyte leaking past the terminals. They were all recalled to be cleaned and sealed. The success of this “fix” depended a lot on the technician’s skill and the effort he put into the job. There are advantages to having assembly done in a factory setting by a guy or gal that does nothing but assemble batteries all day long. I’ve seen quite a few pretty poorly done resealing jobs. I don’t know whether the fault lies with skill or “flat-rate” time pressure.
Anyway, I suspect that the “fix” saved some batteries and caused premature failure on others. Despite the Gen1s battery issues, it has been rare to see one fail sooner than 100,000 miles — this is pretty good in my opinion, especially when you consider that the Prius is the first hybrid that sold at such a high volume.
The Gen2 Prius batteries are performing much better than the Gen1. I’ve seen Gen2s with 200K on the original battery.
How much does a Prius battery cost to replace?
The Gen1 battery packs were about $2500 (a price which will likely fluctuate) and the labor to replace them was about 3.5 hours. The actual R&R (remove & replace) is pretty quick. About 45 min for removal and an hour for putting it back in. The remaining 1.75 hours is for transferring components from the old battery pack to the new battery pack.
So now you know “How long?” and “How much?”, which leaves “How can you tell if a Prius battery is beginning to fail?”
How can you tell when a Prius battery is beginning to fail?
The HV ECU monitors battery condition, and will alert you that the battery performance has degraded below an acceptable performance threshold with a warning light. But it seems that is not good enough for folks who are in the market for a used hybrid. For them, I have devised a method for testing battery condition.
Well, that’s not entirely true. It’s actually just the same test procedure for the confirming a P3006 is legit. I just found a nice way to graph it on the Techstream, and took some sample data on a few cars with known battery conditions — one with a new battery, one with a bad battery, and one with a 60K / 7 year old battery that had no problems.
Here comes the bathtub science! (Like “bathtub cheese”, or “bathtub gin”, “bathtub science” is home-made, by people without professional training, and may be of dubious quality.)
A Primer
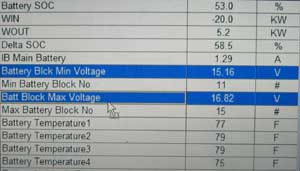
The Prius battery consists of a bunch of individual battery blocks wired in series. Each battery block is about 15V. The HV Battery ECU monitors the voltage of each individual block. All of the block voltages vary slightly. Whichever block has the lowest voltage is reported in a PID (Parameter ID) called Battery Min Block Voltage. This PID will jump to whichever block is the lowest at the moment, so it may be the voltage for block 10 one second, then block 13 the next second. There is also a PID called Battery Max Block Voltage. It’s the same as the Min Block PID, except it reports the block that has the highest voltage.
These two PIDs can be used to determine the condition of the battery pack. Battery block performance can be affected by temperature and I’m sure other variables as well. So how can you tell if a battery block is performing adequately given its current situation? Easy, you look at the identical battery blocks right next to it, which are performing under the exact same conditions. If one block in the pack is doing something wildly different than the others, something’s not right. By looking at the highest and lowest blocks, the HV Battery ECU is able to judge the condition of the battery pack.
The setup
The picture below is a recording on the Toyota Techstream scanner. I have graphed the Min Block Voltage and the Max Block Voltage using an overlapping graph. I have turned off auto-ranging amplitude and set identical minimum and maximum scale values for both PIDs. If you use the default settings, you end up with a pretty useless graph.
The length of the capture is five minutes, so each division is about 30 seconds. The capture trigger was set to “10% before”, meaning that once the trigger button was pressed, the recording started about 30 seconds before the button was pressed.
The object of the test is to discharge the battery and observe the difference between the Min Block V and the Max Block V as the battery is stressed. So, how do you discharge a Prius battery?
Testing
The test goes like this — Start the car and allow it to warm up. Put it in reverse. Wait for the engine to stop running (if it’s not already running, wait for it to start, then wait for it to stop running). Press the trigger button and simultaneously step on the gas and brake at the same time.
By doing this you are discharging the battery with the MG2, which is trying to roll you backwards, but the brakes (hopefully!) are preventing you from moving. THE ENGINE (ICE) MUST BE OFF! When the ICE is running, the battery is charging. That’s the last thing you want when you are trying to discharge the battery. This is the rule for the test: ICE on = throttle off. ICE off = throttle on. You are trying to discharge and recharge the battery pack while observing the voltages.
Analyzing the data
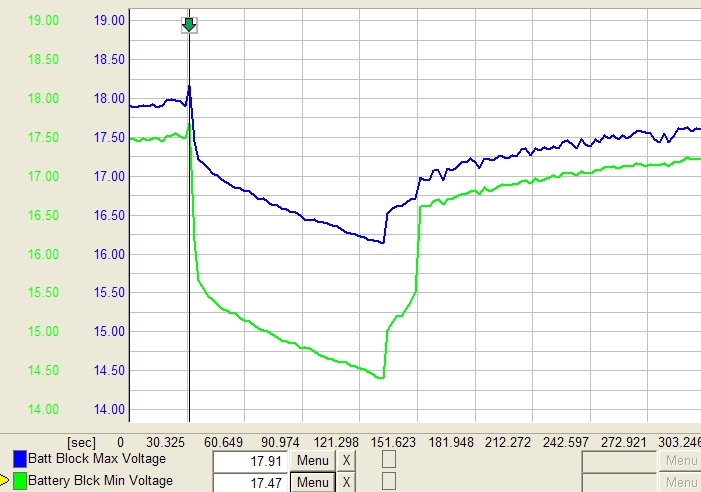
A bad hybrid battery
In the graph below, the MIN & MAX are pretty close when the ICE is running. But as soon as the ICE shuts off and the battery is loaded with the throttle & MG2, the voltages make a major split! There are about 7 divisions between the MIN and the MAX and each division is .5 volts. That’s a 3.5 volt difference. The maximum allowable difference is 1.2V. This battery pack is very, very bad. Notice that the voltages come back together pretty quickly once the ICE restarts and the throttle is released. Also notice that the battery pack was discharged in only 1 minute 45 seconds and the ICE had to start. Finally, take a look the amplitude — the MAX reaches 18V and the MIN drops down to 14.5V.
A good hybrid battery
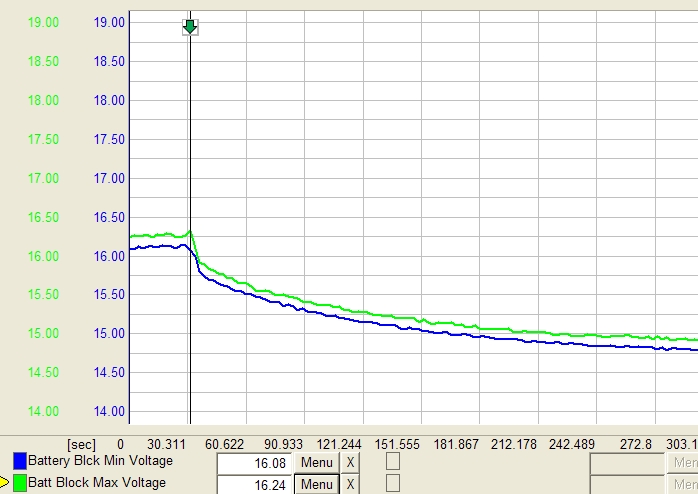
Now let’s take a look at a recording taken on the same car, with a brand new battery. The graph setup is exactly the same, and the test was done in the same way.
There are quite a few differences. First, the MIN and MAX remain within a 1/4 volt from each other during the entire discharge cycle. That’s pretty different from the bad battery’s performance, where the MIN and MAX drifted apart 3.5V under load.
Also notice how long the discharge cycle lasted. Under the exact same load conditions, the new battery was able to discharge for over 4 1/2 minutes before the ICE kicked on to start recharging. That’s about 2.5 times the capacity of the bad battery.
Finally, take a look at the amplitude. The fully charged voltage is just over 16V and drops to just under 15V. Compare that to the bad battery where the range was 18V to 14.5V
I am far from a battery expert, but of the three differences — separation between Min Block V / Max Block V, time to discharge, and separation between fully charged voltage and fully discharged voltage — I feel that the separation between the Min Block Voltage and the Max Block Voltage will be the most reliable indicator of overall battery pack condition.
A good old battery
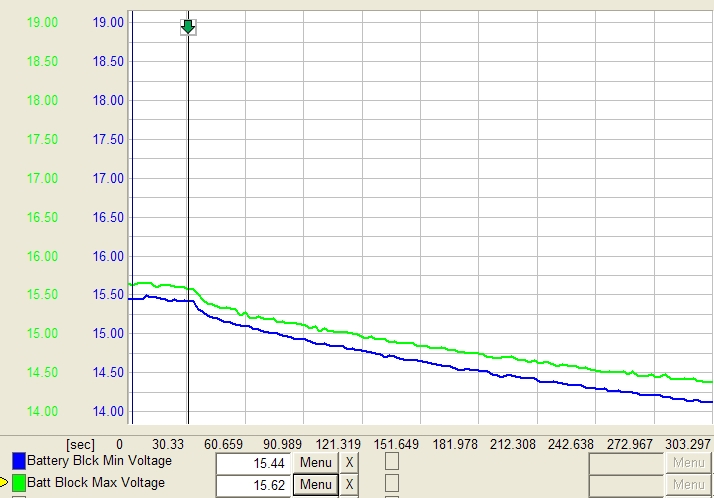
So let’s take a look at a known good battery pack that’s been in service for a while. This recording is from a 2001 Prius, same as the other two recordings. The car is 7 years old, just like the other two Priuses that had bad batteries, but the mileage is considerably lower; this car has 58,000 miles on the odometer. This car came in for a 5K service and the owner had no problems to report.
So, like the bad battery and the new battery, the greatest difference between the Min Block Voltage and the Max Block Voltage is at the end of the discharge cycle. The brand new battery had a maximum difference of about 0.16V, the battery had a maximum difference of about 3.5V, the good used battery (as you can see below) had a maximum difference of 0.28V. The Toyota test specifies a maximum difference of 1.2V.
Oddly, the Prius with the bad battery’s MWL light had just come on, which begs the question — As far as self diagnosis and the trouble code P3006 are concerned, does the MWL really come on when there is a difference of 1.2V between the Min Block Voltage and the Max Block voltage? Either the criteria for setting a P3006 is actually much more lax than the 1.2V spec, OR, the battery pack suddenly deteriorated rapidly, going from a 1.2V difference to a 3.5V difference in only one day, OR, the voltage difference between Min Block Voltage and Max Block Voltage is less pronounced in daily driving than when power braking in the bay.
Could this work to predict the future?
Regardless of the answer, I think 1.2V is a good “good/bad” cut point for battery pack testing. So, for hybrid customers who want to know, “It the battery in good shape?”, I suggest the following.
0.20V = 100% acceptable efficiency
0.45V = 75% acceptable efficiency
0.70V = 50% acceptable efficiency
0.95V = 25% acceptable efficiency
1.20V = 0% acceptable efficiency
I had originally typed the chart above with “% life remaining”. However, I think it’s almost certain that battery deterioration will not be that linear. I’m sure Toyota and Panasonic have done studies and their engineers no doubt have stacks of data, but I don’t have access to it, so my testing and conclusions on a sample of three will have to do for the moment.