
When people ask for hybrid battery testing, they usually want to know how much longer their battery will last. They’re wondering if they should sell their car now or invest in the maintenance and repairs they’ll need to keep it going. I wish I could tell them. A hybrid battery health check can show how the battery behaves today. It can’t tell us its retirement date.
At Art’s Automotive in Berkeley, we use scan-tool recordings to compare battery block voltages and watch charge moving into and out of the pack. Below, I’ll explain the test and share the graphs from a 2008 Toyota Prius. This example uses a NiMH hybrid battery; other battery types and vehicles need their own test methods.
A Caveat
When it comes to hybrid vehicle repair, we’re experts. However, we’re not battery engineers. I suspect we’ve gotten some things wrong here. If anyone reading this is an expert in this field and wants to put Cunningham’s Law into action, please do. I’m always grateful to improve my knowledge.
That said, if you want us to, we’ll do our best to evaluate your hybrid battery’s condition. However, we’ll try to talk you out of it first. Why? Because there is no way to predict the most common hybrid battery failure – a shorted cell. This can happen any time, even when the battery capacity and balance are great. We could evaluate your battery today, and it could spontaneously fail tomorrow with a shorted cell. I think I’d feel ripped off if that happened to me, so we’re going to warn you up front.
We’ve been testing hybrid batteries for a while
I published my first webpage documenting my attempts to predict how much life a hybrid’s battery had remaining around 2012. I’ve learned more over the years. Probably most importantly that testing hybrid batteries has very limited value.
How do you check a hybrid battery’s condition?
These days (2026 for those of you in the future), I use AI for just about everything. One of the very useful things with AI is to have it analyze data exported from a scan tool or digital storage oscilloscope. This makes it possible to analyze way more data in way less time than it would take a human.
The Toyota scan tool (the GTS+) can export live data recordings in CSV format, and that can be uploaded into ChatGPT, or whatever your favorite AI is.
What do capacity and balance tell us?
There are two main problems that develop when a battery ages:
- Its capacity decreases
- It becomes less balanced
The capacity is pretty easy to understand. I like to use water analogies for electrical concepts.
You have a bucket you use to fill a horse trough from a river. Why don’t the horses just drink from the river directly? I don’t know. Focus.
When the bucket is new it holds a gallon, but over time mud from the river starts building up on the bottom of the bucket. After 3 years of use, the bucket has 3″ of mud stuck to the bottom. Now the bucket only holds 3/4 gallon of water because mud is occupying some of its capacity. This continues until eventually you’re charging your mobile phone four times a day.
Loss of capacity usually isn’t what causes a battery to fail, at least not in the warning lights are on sense. It can cause a decrease in fuel economy. The main reason hybrids exist, at least non-plug-in models, is to capture energy wasted by braking. When you brake, you’re filling the bucket and the bucket can power the car later. When the bucket holds less water, it gets full quickly and you’re back to wasting energy when you brake.
How a Prius battery is put together
In order to understand balance, you need to know a little about hybrid battery design. The battery isn’t really one big bucket. It’s lots of little buckets. The high voltage comes from a battery pack made of many lower-voltage cells. It’s a pack, as in a collection of many.
An older Prius with a 201V battery is made up of 1.2V cells. 1.2V is the voltage produced by the NiMH battery chemistry. The 1.2V cells are connected together in series (connected positive to negative). When batteries are connected like this the voltage of each cell is added together to create the total pack voltage. The Prius battery is designed as follows:
- Six 1.2V cells in series create a battery blade. A blade is 7.2V. This is the smallest physical unit in the battery and is encased in plastic with a positive and negative terminal.
- Two battery blades are connected in series to create a 14.4V block monitored by the hybrid battery control unit.
- Fourteen 14.4V blocks are connected in series to create a 201.6V pack.
So, there are 168, 1.2V buckets in the battery. Each one has its own capacity. Battery balance involves how well the capacity and state of charge of all 168 buckets match.
Why does battery balance matter?
When a battery pack is connected in series, any current (current is analogous to water flow) pushed into or drawn out of the battery pack will be shared by each cell equally.
Let’s say you have two one-gallon buckets. Neither contains water, but one is half full of dirt. You pour one gallon of water into each. What happens? The bucket with the dirt in it overflows and now there’s water all over the ground.
In a battery, when you continue to charge a cell when it’s already full it overheats and overheating damages it. Likewise, discharging a cell to below its minimum voltage will also damage it.
Voltage is electrical pressure and the water analogy works here too. The taller the column of water, the higher the pressure at the bottom. Have your ears ever hurt when you swim in deep water? It’s because the pressure is higher the deeper you go. The illustration shows why pressure alone doesn’t tell us capacity: a narrow cylinder and a wide one can have the same water height and pressure. Battery voltage also changes with current, temperature, and charge history, so it isn’t a direct SOC gauge.

A quick review of our water analogy terms before I begin using the actual electrical term for the remainder of the article.
- Capacity = charge capacity in amp-hours (Ah) = how much water the bucket holds
- Current = electrical flow (amps) = water flow per unit of time
- Voltage = electrical pressure (volts) = water pressure
- SOC = state of charge (%) = how full the bucket is
How the capacity test works
For this test, we partly empty the battery, let the car refill it, and record what happens. Imagine it like this. You have a bucket that’s full of water. You know it’s a one-gallon bucket, and you know where the water level is (SOC), but you don’t know how much lower the capacity of the bucket is than when it was new.
In this test we’re monitoring the rate at which we’re removing water from the bucket and how long it takes the battery to reach 40% SOC, when the gas engine starts. How many amps over how much time. Charge capacity is measured in amp-hours (Ah). The current doesn’t have to be one amp: we add up the current over time to find how much charge moved.
To draw current from the battery, I put the Prius in reverse and step on the gas and brake at the same time. This causes the MG2 to draw current while it strains to move the car, discharging the battery. The brakes keep the car still.
At around 40% SOC, the control unit starts the engine to recharge the battery. As soon as this happens, I release the accelerator and let the battery charge. When the engine stops at around 50% SOC, I step on the gas again and repeat the cycle.
I set the scan tool to record the following information:
- SOC: how full the car thinks the battery is.
- Current: how quickly charge is going in or coming out.
- The highest and lowest block voltages, and which blocks those are.
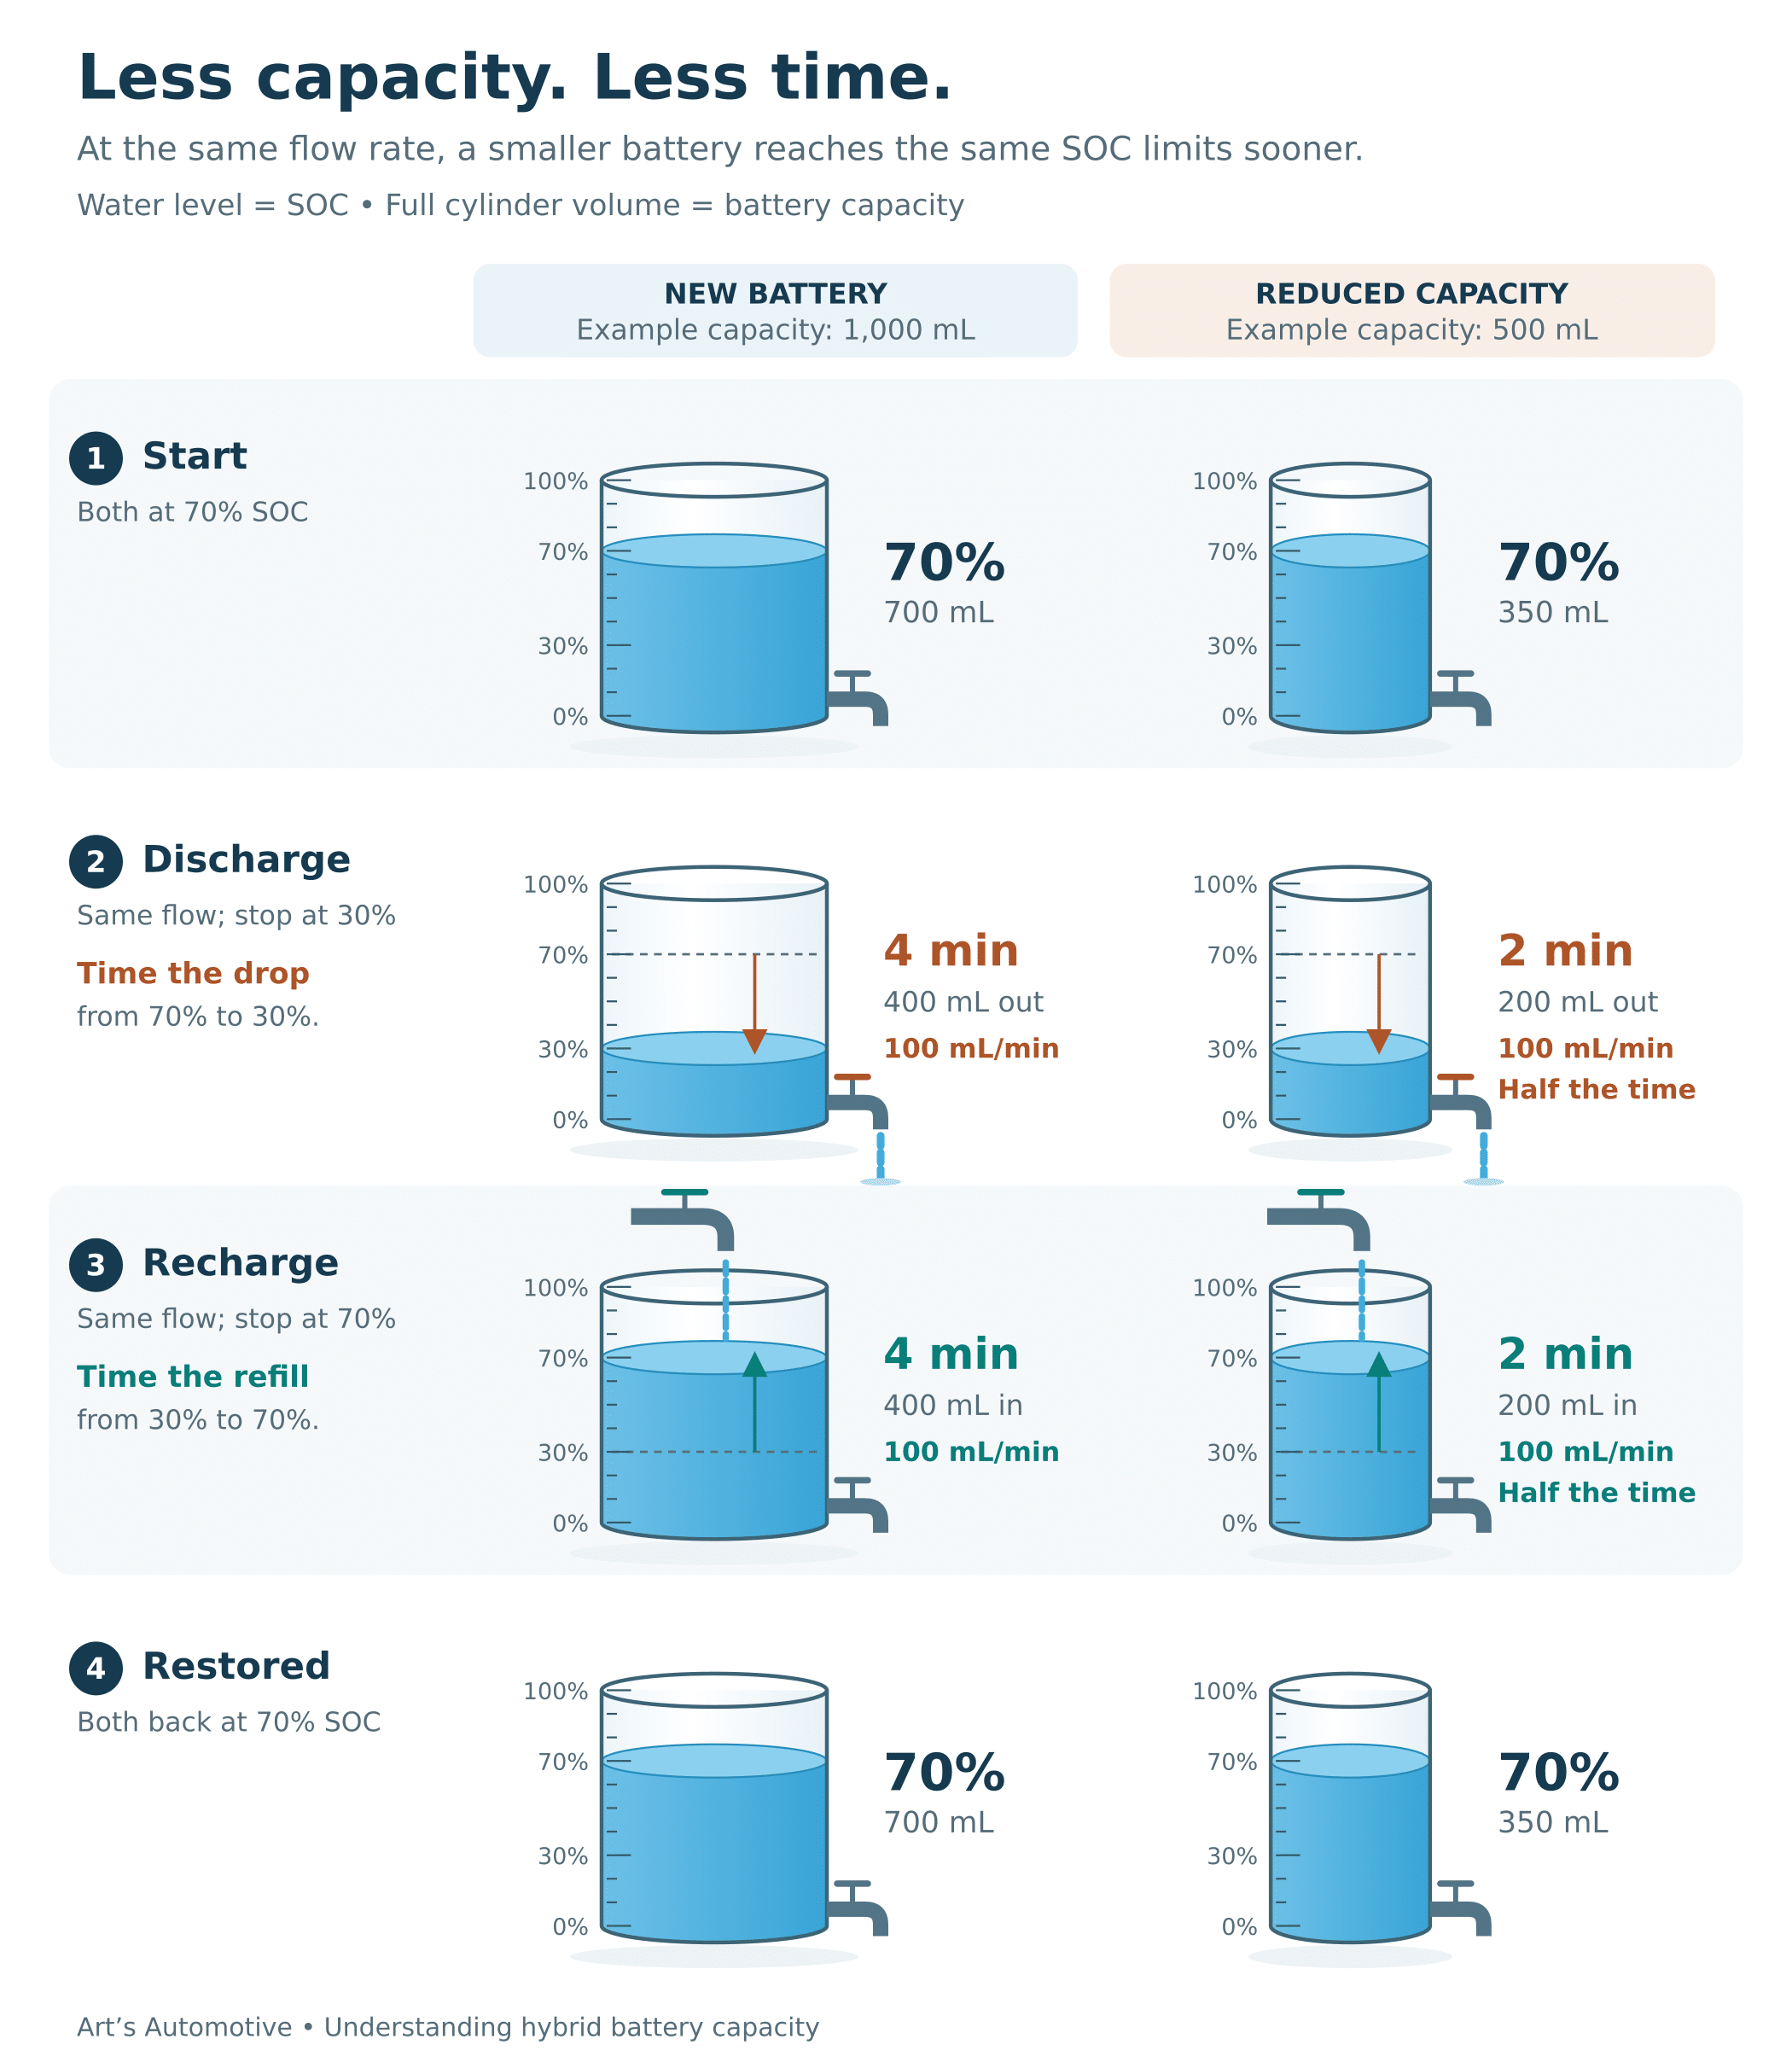
Think of draining a bucket from half full to 40% full. If we measure how much water comes out, we should be able to work out the bucket’s capacity.
Monitoring SOC
SOC is an estimate based partly on pack voltage and watching current, but there’s a lot more to it. SOC is a better metric for our calculation than pack voltage because the decrease/increase in pack voltage vs. SOC% isn’t linear throughout its range, and battery temperature and often learned data are also used in the calculation to increase accuracy.
Another issue is that we’re monitoring only a small slice of the charge discharge cycle. In this case between 40% and 50% SOC. This is because we’re working within the vehicle design. We can’t control when the internal combustion engine (ICE) starts to charge the car.
Monitoring block balance
For balance, we compare how the blocks respond to charging and discharging. A weak block may drop lower under load or rise higher during charging. We’re looking at the lowest and highest block voltages during both charging and discharging and comparing the difference between them. Conveniently Toyota has two data PIDs that help with this. One is whichever block has the lowest voltage at that moment; the other is the highest at that moment. There are two additional PIDs that indicate which block voltage is being displayed for the min and max PIDs.
- Battery Blck Min Voltage
- Battery Blck Max Voltage
- Min Battery Block No.
- Max Battery Block No.
Toyota hybrid battery testing: a 2008 Prius example
Here’s what we found on a 2008 Prius tested in September 2026. The owner says its battery is original.
We recorded two discharge/recharge cycles over about 15 minutes. I used the second cycle for the capacity calculation because it followed a recorded recharge. The first started wherever the battery happened to be when I got in.
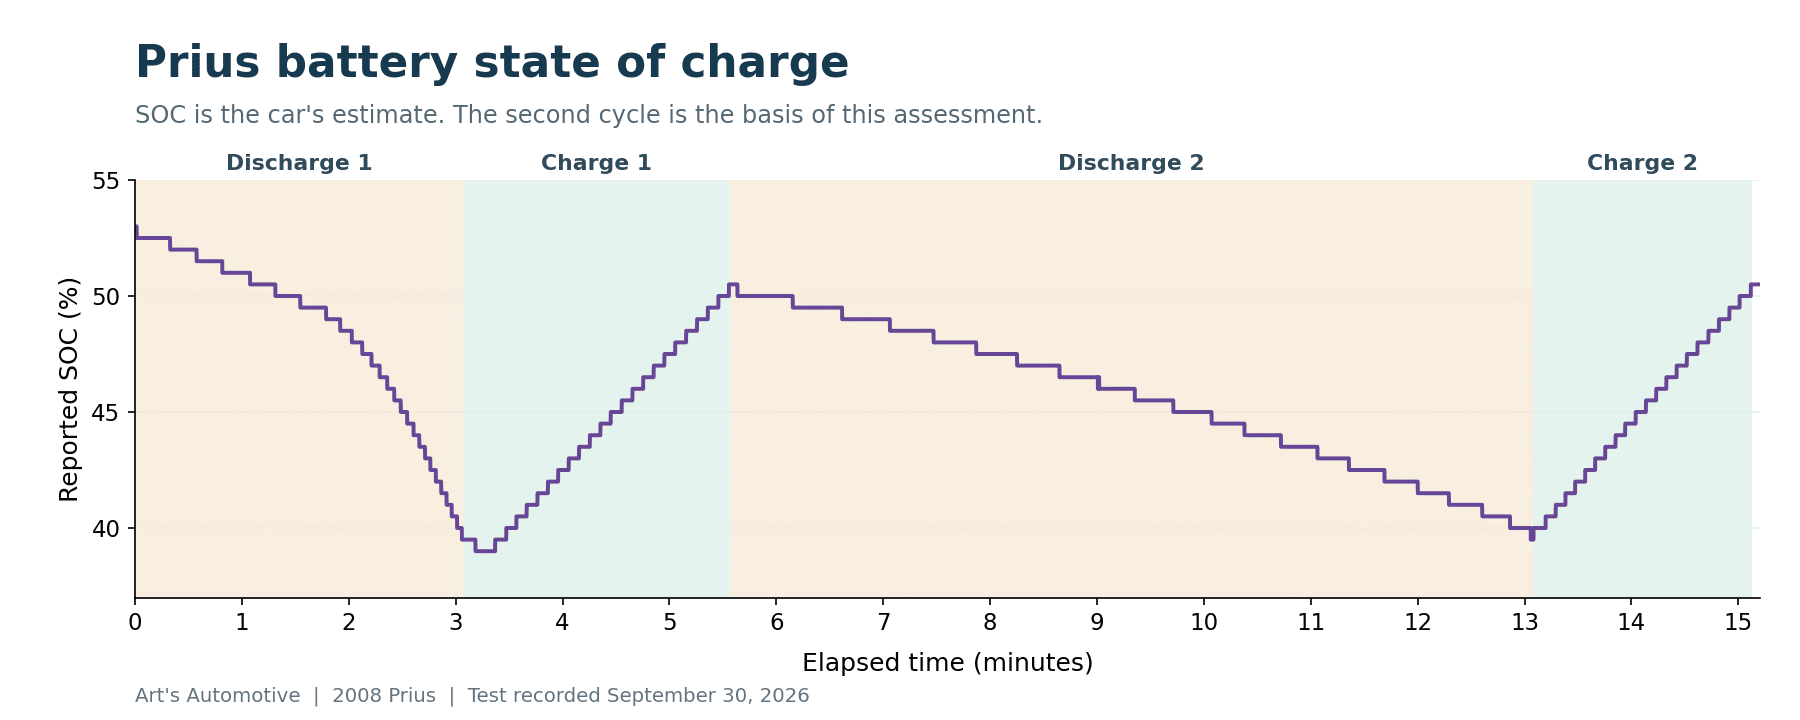
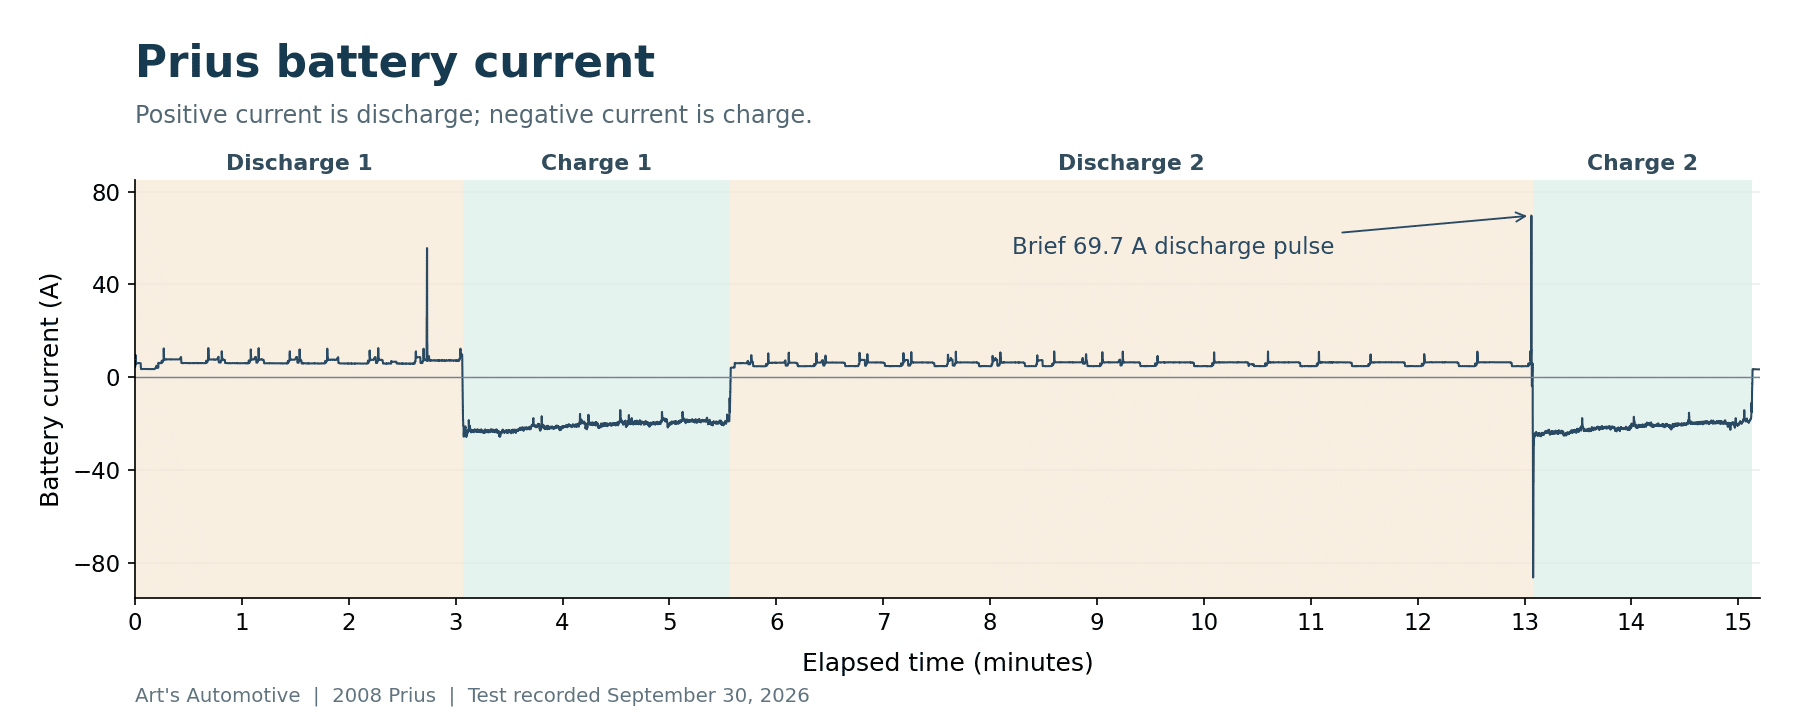
The recording contained 14,855 samples. Adding up current over the actual time between samples gives the amp-hours transferred.
| Second cycle | Discharge | Charge |
|---|---|---|
| Reported SOC | 50.5% → 39.5% | 39.5% → 50.5% |
| Time | 7 min 30 sec | 2 min 3 sec |
| Average current | 5.90 A out | 21.47 A in |
| Charge transferred | 0.738 Ah out | 0.734 Ah in |
| Apparent full capacity | 6.71 Ah | 6.67 Ah |
What the capacity result means
The discharge calculation is 0.738 Ah ÷ 0.11 = 6.71 Ah. Toyota rated this battery at 6.5 Ah when new. That puts our result at about 103% of its original rating.
Better than new after nearly 19 years? I wouldn’t put that on the invoice.
It illustrates the limitations of this test. We’re extrapolating from an 11-percentage-point change in estimated SOC. Rounding and corrections to that estimate affect the answer. The first cycle was less consistent and may have included an SOC correction.
The SOC estimate can itself depend on current integration, so this calculation is not an independent measurement of true capacity.
A dependable capacity measurement would require controlled testing over a much wider charge/discharge range. Another approach is for the HV battery control unit to estimate capacity over many charge/discharge cycles. That feature would need to be built into the car, as it is on many devices like your mobile phone, laptop, etc. A few Honda vehicles display a battery capacity estimate in scan data, which is cool. It may exist on some Toyota vehicles now too. I’m more often in the office than I am working on cars these days, so it often takes me a while to become aware of changes in new models.
What the block voltages tell us
The block voltages give us a more useful observation: they stayed close together.
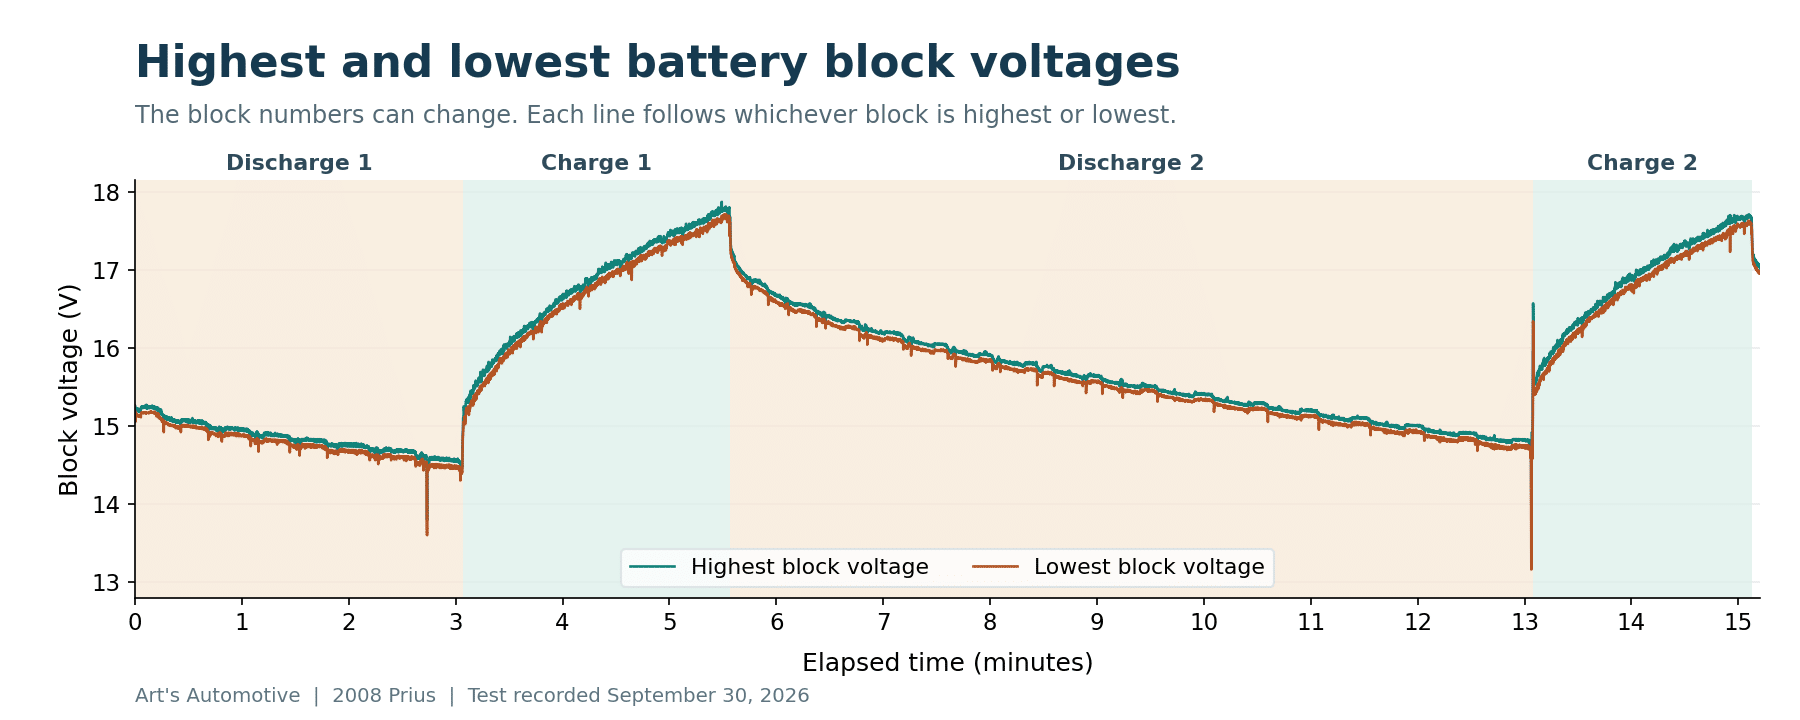
During the second cycle, the median difference between the highest and lowest blocks was 0.08 V during steady discharge and 0.11 V during charging. For 95% of those samples, the differences were no more than 0.10 V and 0.17 V, respectively.
The highest and lowest block numbers change, so these lines aren’t following the same two blocks throughout the test.
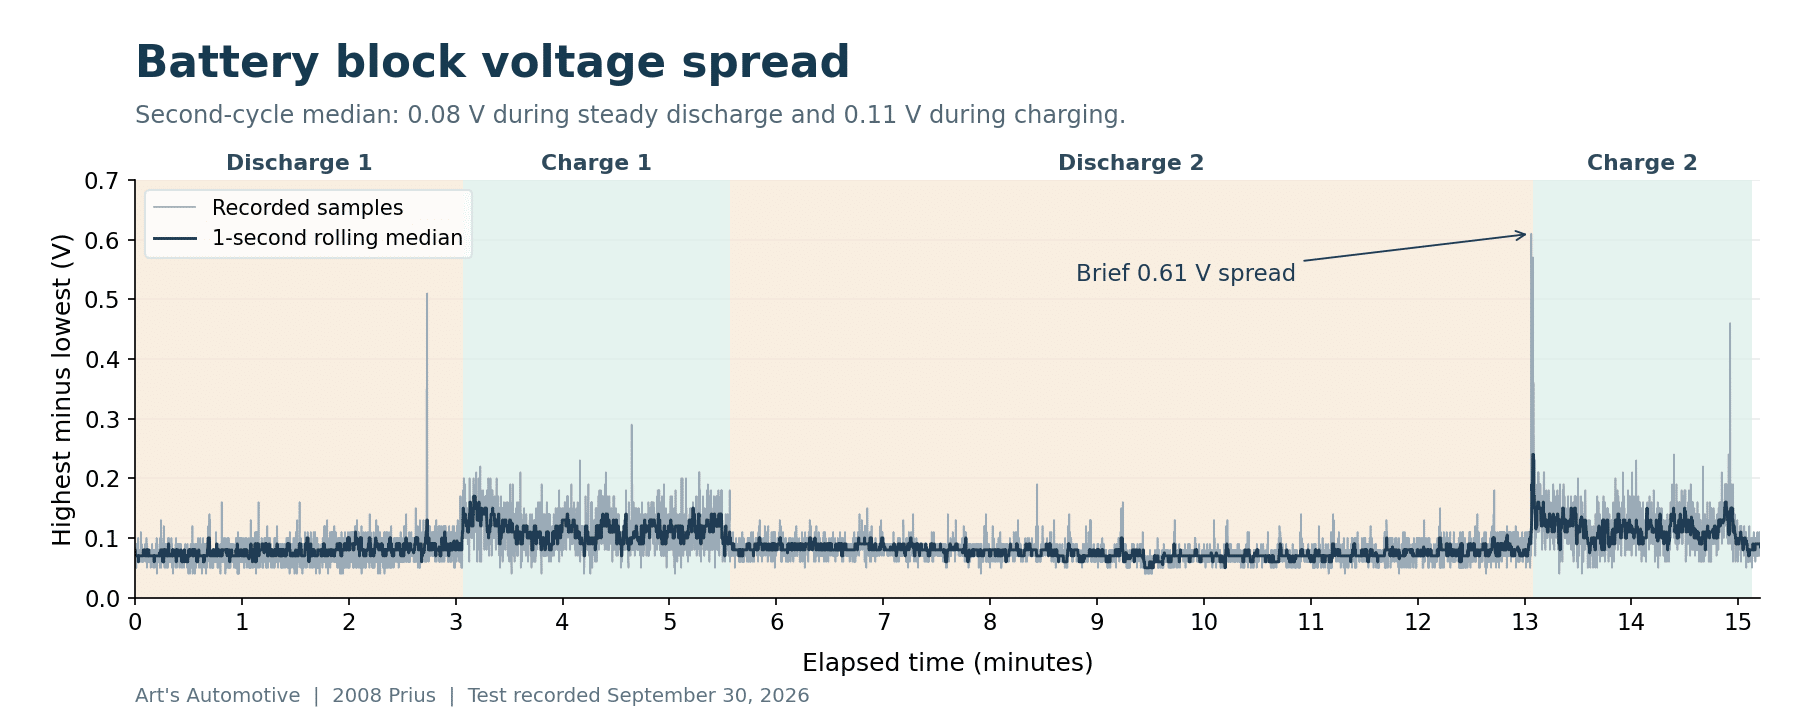
The largest discharge pulse was 69.7 A, with a momentary voltage spread of 0.61 V. I suspect this was engine starting: MG1 cranking the engine while MG2 also applied holding torque. We didn’t record the individual motor currents, so that remains an explanation, not a confirmed finding. There were also brief voltage excursions during charging.
Near the end of discharge, block 9 was often lowest and block 13 was often highest. That doesn’t establish them as the worst and best blocks. Voltage differences can reflect capacity, SOC, internal resistance, and temperature. This recording cannot separate those effects or assign individual block capacities or SOC percentages.
How can you tell if a hybrid battery is still good?
My conclusion: block-to-block voltage balance looks good. This limited test showed no obvious battery problem and gave us no reason to recommend replacement.
If original, the battery is nearly 19 years old—beyond the 10–15 years we commonly expect in the shop. Apparently, it hasn’t read the memo.
I can’t turn these results into a remaining-life estimate. Voltage differences can increase with age, but I haven’t found a dependable way to translate them into years or miles. And this test cannot rule out a shorted cell developing tomorrow.
The battery behaved well during the test. That’s what we can honestly tell its owner.
Hybrid battery testing in Berkeley
If you’re considering a hybrid battery health check, contact Art’s Automotive. Tell us what you’re trying to find out, and we’ll explain what testing your car can reasonably tell you.
If your battery has failed, our hybrid battery replacement guide covers replacement options and costs. For the small auxiliary or starting battery, see our separate article on 12V battery testing.